2021:4
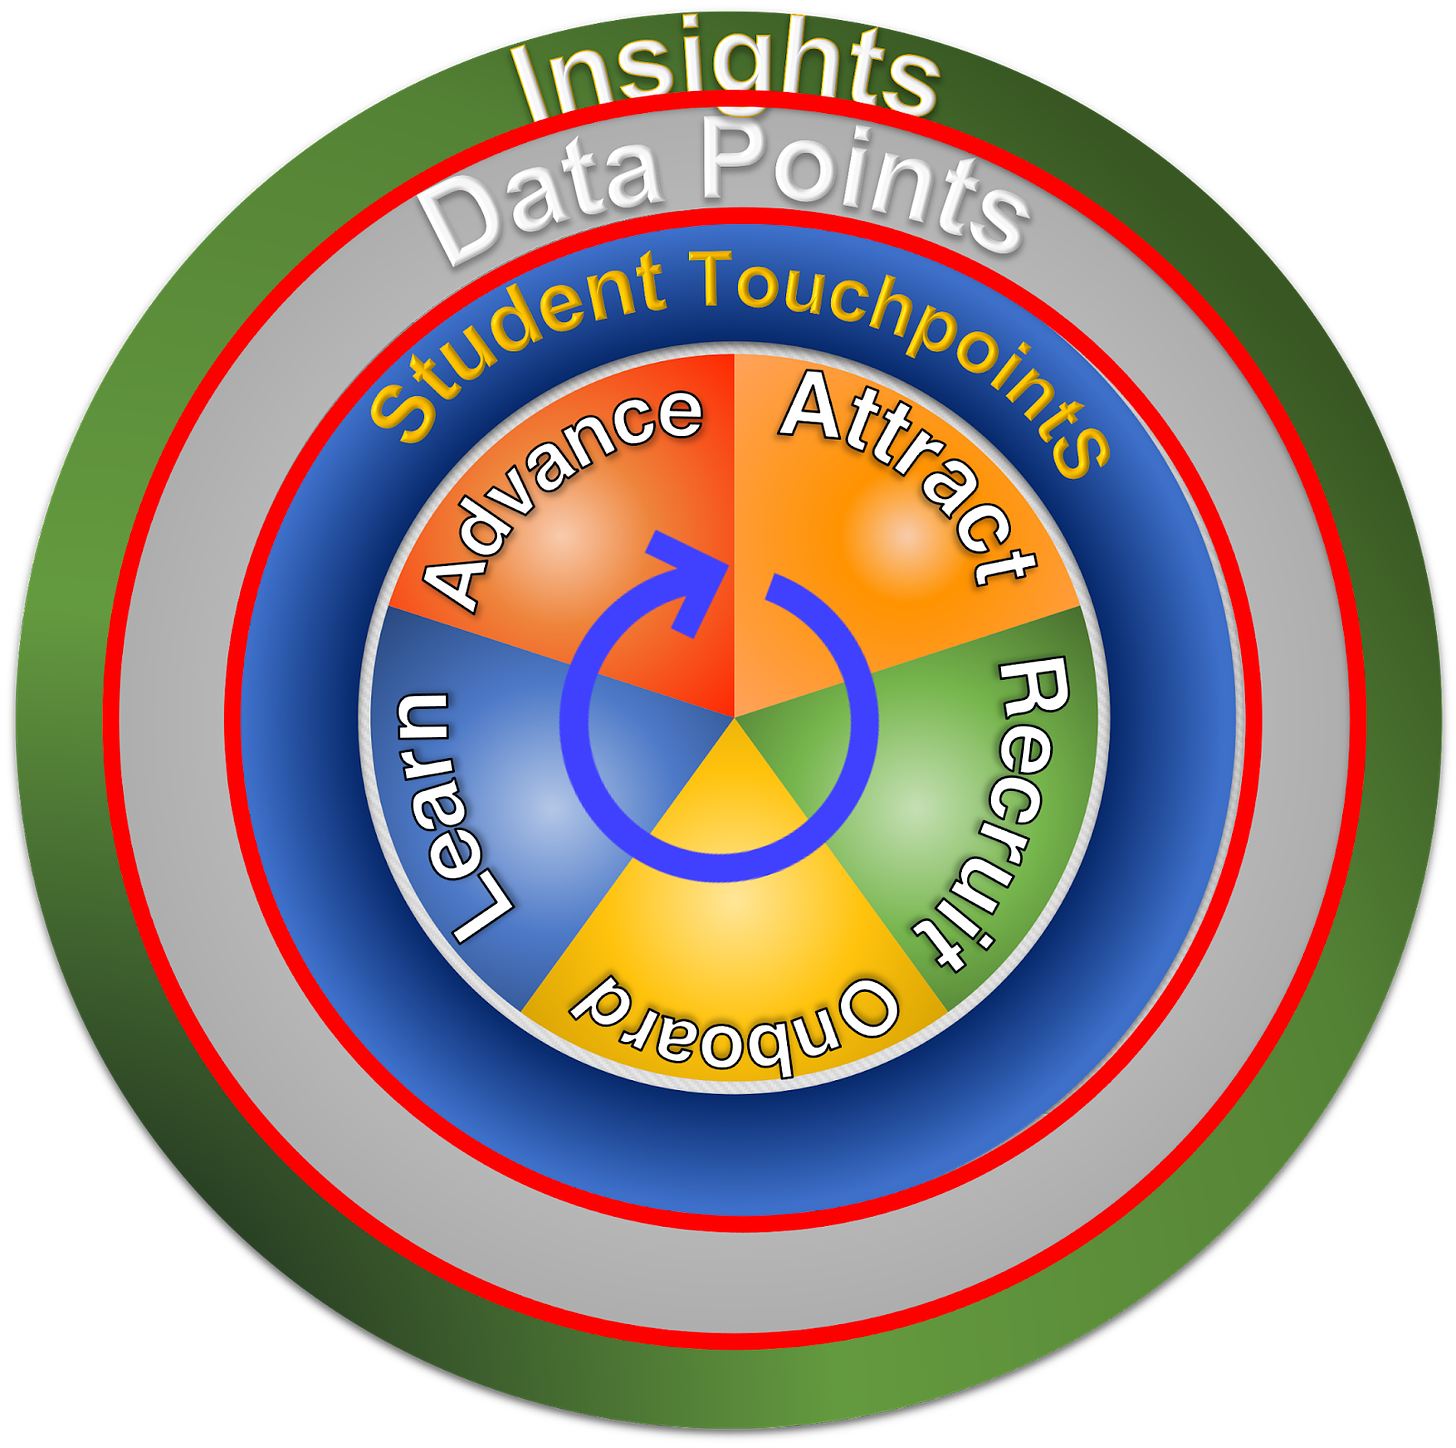
Bridging student touchpoints to insights requires an understanding of identifying data that matters to student success.Avoiding two common mistakes with data points
A key part of using the Student360 model is using data to guide our work in helping students grow and succeed. Many educators buy into this idea and tout themselves as “data-driven”. At one university where I served, the mantra was that “we measure everything that moves”. Both approaches typically lack a focus on data that matters for student success.
What is typically described by data-driven often amounts to using standardized testing to guide curriculum and instruction decisions. This approach is simply too narrow. Student success, looked at as persisting and completing education, is influenced by more than what is measured in standardized test scores.
Those claiming to measure everything that moves commit one of the deadly sins of performance management. Measuring anything and everything leads to unneeded costs, bloated information systems, and piles of unused data. More critically, oversampling of data dilutes focus from what is key to helping students succeed. The movement towards key result areas (KRAs) in evaluating the performance of companies provides a good contrast.
How to avoid these mistakes? For one, think of measuring across the student lifecycle rather than just during the admissions or learning phases. Also, for each phase of the student lifecycle, measures should be selected that have meaning in terms of reflecting student success.
A Data Architecture for the Student Lifecycle
An understanding of student success needs to start with a clear focus on key result areas or KRAs. The word “key” in key results areas tells it all. The process of identifying and selecting data points from student touchpoints should focus on strategies that will help students stay in programs and successfully complete their studies. It really is as simple as that.
We need to counter the promises of IT that come with each generation of new technology that we can scoop up massive amounts of data and magically derive helpful insights. Today it may be AI or machine learning but two decades ago it was relational databases and a decade ago it was data warehousing. A reasonable process actually does not take massive pre-investments in technology but good use of smart people.
Start by asking who has the most contact with students. In a typical student lifecycle in higher education, the three groups with the most contact with the dynamics of student success are, in order of level of engagement, faculty, student affairs, admissions, and alumni relations. These groups often have not only insights from an institution’s current and past students but also the broader range of academia.
Workshops can be used to help tease out the key result areas (KRAs) in each of the student lifecycle phases. A technique that has worked very well in my practice has been to facilitate towards a limit of two to three KRAs per lifecycle stage. Such an approach ensures that the results areas and indicators are truly key for success rather than just representing activity. It also forces a focus on the student rather than the activities of the institution.
There are many techniques to leverage institutional knowledge to develop KRAs and ultimately ways to measure and represent success. One technique that I have used is based on the Ishikawa or fishbone quality tool and uses the approach to focus on meaningful data. Briefly how this approach works is to alter the focus from problem-solving to solution generation.
Ideally, the approach should reflect all student lifecycle phases either with a separate analysis for each or grouping two together. My favorite framework is the 6M model as shown below with education-specific designations and the lifecycle phases.
Rather than a problem being diagnosed, the focus is on what defines a successful student in each lifecycle phase. The branches of the diagram can then be used to brainstorm success approaches in an appreciative manner. Once a picture of success is painted for each of the lifecycle phases the analysis turns to developing result areas and supporting data with measures.
From KRAs to Data to Success Insights
The use of KRAs to develop data and success measures next leads to insights for success. Future issues of the Student360.Report will focus on ways to glean and use insights for student success.
About the Student 360.Report
The Student360.Report is a commentary of key topics in higher education from a student-centered perspective. The Report is a product of EduPartner.Solutions OÜ, a data analytics as a service (DAaaS) company focused on assisting higher education with understanding and driving to higher levels of student success.


